A Smarter Green Thumb Powered by Microchip
By Michael Parks for Mouser Electronics
In its 2017 Revision of World Population Prospects, the United Nations predicted that the world population will hit nearly ten billion around the year 2050, up from the almost 8,000,000,000 humans currently inhabiting the globe. If those projections hold true, our planet will soon feed another 2,000,000,000 mouths every day. Access to nutritious and affordable foods such as fruits, vegetables, and nuts will be key to a healthy population free from hunger. Thankfully, the human species has a few thousand years of experience with horticulture from which to draw lessons learned.
“Horticulture is defined . . . as the science that employs special techniques and methods to cultivate plants, including methods used to properly condition the soil for seed planting or planting tubers. The domain of horticulture includes cultivation, plant propagation, breeding of plants, production of crops, plant physiology as well as biochemistry and genetic engineering,” explains an article entitled the “Difference Between Agriculture and Horticulture” by DifferenceBetween.net. Put another way, the weekend warrior horticulturalists may engage in the art and science of gardening.
Advancements in sensor technology and associated embedded electronics has driven the costs down significantly. Now, even a part-time greenhouse gardener that possesses only a modicum of the “do-it-yourself” spirit can become empowered to remotely monitor his/her garden. This project will lay out a design for a device to do just that. The goal is to empower almost anyone with basic electronics and software skills with the ability to build this monitoring system.
Understanding Environment and Soil Quality
Regardless of whether one is a professional horticulturalist or amateur gardener, understanding the quality of the environment and the soil is necessary to make informed decisions that affect the quality, nutritional value, and yield of plant-based foods. Some of the crucial variables that must be monitored include:
Temperature
Extremely high and low temperatures can have adverse effects on the health of plants. High temperatures can cause an imbalance in the photosynthesis and respiration processes which can result in plant suffocation. Conversely, low temperatures can cause plant cells to freeze which inhibits a plant from getting nutrients.
Humidity
High relative humidity levels prevent a plant from evaporating water as part of its transpiration process. It can also prevent the plant from drawing nutrients from the soil. If these conditions are permitted to continue the plant could rot or suffer bacterial or mold infections.
Moisture Content
The amount of water in the soil must be kept at optimal levels for ideal plant growth. Too much water can result in root rot, which prevents the plant from extracting oxygen from the soil. Too little moisture and nutrients cannot circulate through the plant.
pH Level
If you recall from chemistry class the pH scale is a way to indicate the acidity or basicity of a substance. The scale ranges from 0.0 for acids such as lemon juice up to 14.0 for bases such as lye. A pH level of 7.0 is considered neutral. While the ideal pH level can vary from plant to plant, optimum pH levels for soil is between 5.5 and 7.0.
CO2 Level
Plants of all types absorb carbon dioxide (CO2) as part of the photosynthesis process in order to synthesize food from water and CO2. Oxygen, in turn, is given off as a byproduct. As with the other factors, too much or too little CO2 can have adverse effects on plant growth and health. As a reference, 250 to 350ppm is considered a normal concentration in an outdoor ambient environment. Indoor environments with decent air circulation should see a concentration from 350 to 1,000ppm.
Materials
This project design uses the Xplained board series from Microchip, which is ideal for rapid prototyping, along with a suite of sensors that will allow the system to monitor the five environmental factors outlined in the previous section. These sensors include the:
- Microchip ATSAMD10-based STEMMA soil moisture sensor
- Bosch BME280 temperature and humidity sensor
- DFRobot SEN0249 soil pH sensor
- MG-811 CO2 sensor
Bill of Materials
Table 1 lists the bill of materials (BOM). Alternatively, you can visit grab all the parts you need from the prebuilt shopping cart at Mouser. At the time of this publication, the BOM is about $240 USD.
Table 1: Bill of Materials.
Quantity | Mouser P/N | Description | Schematic P/N |
| 1 | 556-ATMEGA328PBXMIN | Development Boards & Kits - AVR ATMeGA328PB Eval Kit | U1 |
| 1 | 474-WRL-13678 | Wi-Fi Development Tools (802.11) WiFi Module ESP8266 | J5 |
| 1 | 932-MIKROE-1978 | Temperature Sensor Development Tools Weather click | J2 |
| 1 | 485-4026 | STEmmA Soil Sensor - I2C Capacitive Moisture Sensor | J1 |
| 1 | 426-SEN0249 | Analog Spear Tip pH Sensor / Meter Kit (for Soil and Food Applications) | J4 |
| 1 | 426-SEN0219 | Analog IR CO2 Sensor | J3 |
| 1 | 854-ZW-MM-20 | Jumper Wires ZipWire MI-MI 20cm 40 UnzippWires x20cm | N/A |
| 1 | 485-757 | 4-Channel Bi Logic Level Eval Board | U2 |
| 1 | 349-M1IOTPROTO | Development Software 1 year subscription to the Medium One cloud environment | N/A |
Resources
Computing Resources
- Windows-based computer running Atmel Studio 7.0
- Wi-Fi network
- An account on Medium One
- GitHub Software Files
Hardware Source Files
An Eagle™ computer-aided design (CAD) schematic and circuit board file are included in the GitHub Hardware folder for those who wish to remix the project to suit their individual needs. For makers, a free version of Eagle CAD can be found with a simple Google® search.
Software Files
The Microchip Xplained board is programmable using Atmel Studio 7. In addition to the prebuilt libraries that the parts vendors provide, the project will require four other files. The first is the firmware file that runs on the Microchip Xplained board. We will also create a header (.h) file to store any sensitive data such as passwords and application programming interface (API) keys, which are things one should avoid sharing with the entire world on GitHub®. Lastly, two library files will be necessary to allow the Xplained board to interact with the CO2 sensor. All four files will reside in the GitHub Software folder .
Images Files
Any visual image or screen captures of the schematic and 3D printer files will reside in this folder for those who don’t have access or who need to view the original source files.
Tools
Finally, we recommend having these tools on hand as you complete the project:
- Wire strippers
- Digital multimeter
- Needle nose pliers
Overview
The sensor boards used in this project communicate back to the Xplained microcontroller board in two ways: By digitally utilizing the Inter-Integrated Circuit (I2C) serial communication protocol or via an analog signal that is read by the microcontroller’s analog-to-digital converter (ADC).
STEMMA Soil Moisture Sensor
Communicates via I2C. The sensor measures the capacitive difference between the two probes and reports and has an integer value from 300 to 500 based on the moisture content of the soil.
BME280 Temperature Sensor
Communicates via I2C. It reports a floating-point number with a unit of measure of degrees Celsius. The value is convertible to degrees Fahrenheit using the formula:
BME280 Humidity Sensor
Communicates via I2C. It reports a floating-point number with a unit of measure in the percentage of relative humidity.
SEN0249 Soil pH Sensor
The output of the sensor is an analog signal from 0 to 5VDC. The pH is a unitless measure that will range from 0 to 14. The formula to calculate the pH level is:
Voltage = ADC × (5V / 1,024)
where ADC is the value read by the microcontroller’s ADC pin connected to the pH sensor.
The formula assumes the microcontroller has a 5V operating voltage and 10-bit ADC. These numbers may require an adjustment if you use an alternative microcontroller with a different operating voltage and/or ADC resolution. Then calculate the pH level:
pH Value = (3.5 × Voltage) + Offset
The offset is a variable that is determined during the calibration process for the pH sensor. Note that this sensor must be recalibrated every two hours. Find more information on the calibration process on the DFRobot site.
MG-811 CO2 Sensor
The output of the sensor is an analog signal from 0 to 5VDC. The unit of measure is the concentration of CO2 in parts per million (ppm). The following formulas are used to translate the analog voltage value to a CO2 concentration in ppm:
Voltage = ADC × (5V / 1,024)
where ADC is the value read by the microcontroller’s ADC pin connected to the MG-811 CO2 sensor.
The formula assumes the microcontroller has a 5V operating voltage and 10-bit ADC. These numbers may require an adjustment if you use an alternative microcontroller with a different operating voltage and/or ADC resolution. If the calculated voltage is less than 0.4V, then the sensor has not yet warmed up enough and no readings should occur at that time. Once the voltage rises above 0.4V, the following formula can be useful to make the final CO2 concentration calculation:
CO2 Concentration (ppm) = [ (Voltage − 0.4) × 5000 ] / 1.6
Building the Electronics
Assembling this project is straightforward (Figure 1). A small breadboard is useful, as there are two devices that require access to the I²C serial communications bus. The nice thing about development boards is they come with the required pull-up resistors for the I²C bus to work. However, if you make a custom printed circuit board (PCB) integrating these devices, remember the resistors on the serial data line (SDA) and serial clock line (SCL) wires. For more tips on I2C customizations check out Mouser’s Chip To Chip: Tips For Using I2C Bench Talk blog.
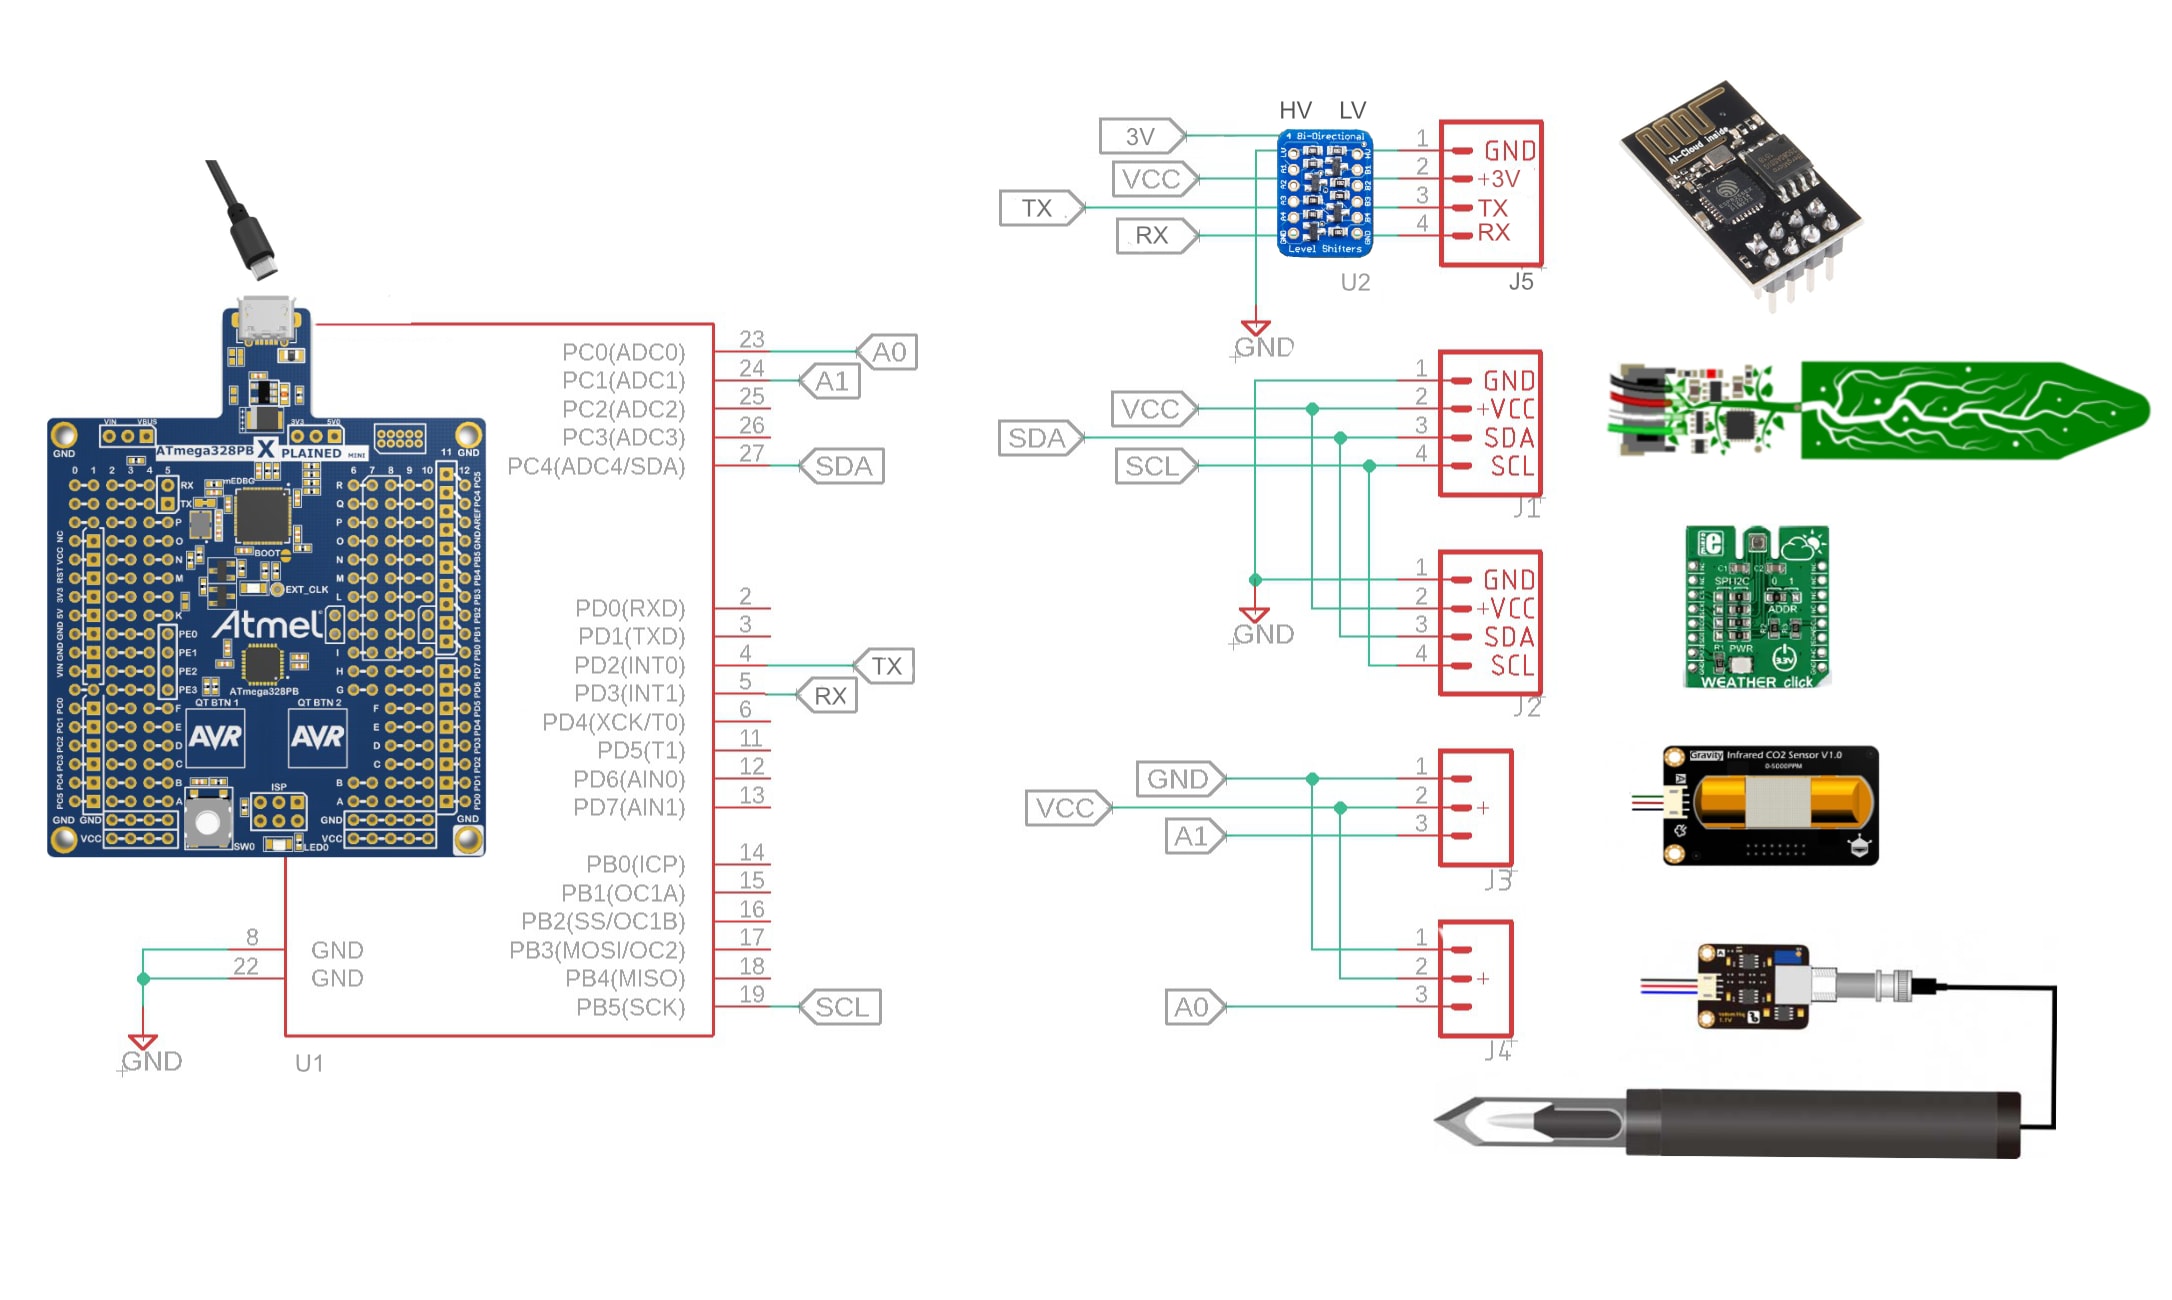
Figure 1: This wiring diagram illustrates all sensor connections in the plant health monitoring system. (Source: Mouser)
STEMMA Soil Moisture Sensor
- Plug the 4-wire JST cable assembly into the JST connector on the signal transmitter board.
- Connect the Vin (red wire) pin of the sensor to the 5V rail of the breadboard.
- Connect the GND (black wire) pin of the sensor to the ground (GND) rail of the breadboard.
- Connect the SDA (white wire) pin of the sensor to the SDA pin of the Xplained board.
- Connect the SCL (green wire) pin of the sensor to the SCL pin of the Xplained board.
Mikro Weather Click BME280 Temperature and Humidity Sensor
- Solder a set of female headers to the Mikro Weather click sensor board.
- Place a wire from the 5V pin to the 5V rail of the breadboard.
- Place a wire from the GND pin to the GND rail of the breadboard.
- Connect the SDA pin of the sensor to the SDA pin of the Xplained board.
- Connect the SCL pin of the sensor to the SCL pin of the Xplained board.
SEN0249 Soil pH Sensor
- Plug the 3-wire JST cable assembly into the JST connector on the signal transmitter board.
- Connect the GND (black wire) pin of the signal transmitter board to the GND rail of the breadboard.
- Connect the +V (red wire) pin of the signal transmitter board to the 5V rail of the breadboard.
- Connect the analog output (blue wire) pin of the signal transmitter board to the A0 pin of the Xplained board.
Analog Infrared CO2 Sensor
- Plug the 3-wire JST cable assembly into the JST connector on the signal transmitter board.
- Connect the GND (black wire) pin of the signal transmitter board to the GND rail of the breadboard.
- Connect the +V (red wire) pin of the signal transmitter board to the 5V rail of the breadboard.
- Connect the analog output (blue wire) pin of the signal transmitter board to the A1 pin of the Xplained board.
SparkFun WiFi Module and Bidirectional Logic Converter Board
- Solder female headers to each side of the bidirectional converter board.
- Place a wire from the HV pin of the converter board to the 5V rail of the breadboard.
- Place a wire from the LV pin of the converter board to the 3V pin of the Xplained microcontroller board.
- Place a wire from the GND pin of the converter board to the GND rail of the breadboard.
- Place a wire from the PD2 pin of the microcontroller to the B1 pin of the converter board.
- Place a wire from the A1 pin of the converter board to the RX pin of the WiFi Module.
- Place a wire from the PD3 pin of the microcontroller to the B2 pin of the converter board.
- Place a wire from the A2 pin of the converter board to the TX pin of the WiFi Module
- Place a wire from the EN pin of the WiFi Module to an available 3.3v to enable the device. (Figure 2).

Figure 2: The schematic capture of plant health monitoring project provides an easy to follow outline of all the necessary connections. (Source: Mouser)
Microchip Xplained Board
- Place a wire from the 5V pin to the 5V rail of the breadboard.
- Place a wire from the GND pin to the GND rail of the breadboard.
- Insert the micro USB cable into the micro USB port of the Xplained board.
- Insert the other end USB cable (Type-A port) into the USB port of a computer.
Software
In this section, we will detail the software side of the project. This will include the firmware and support files essential for the Microchip Xplained board as well as the setup of the Medium One sandbox in your Web browser. Be sure to download the latest version of Atmel Studio 7 (Figure 3).

Figure 3: Atmel Studio 7 is useful for firmware edits, project-specific needs, and for enhanced functionality such as debugging. (Source: Mouser)
Setting up the Microchip Xplained Board Firmware
Project Files
Table 2 identifies the Microchip Xplained project files in this project’s GitHub repository:
Table 2: The Microchip Xplained project files, used for to create this project are outlined below.
File Name | Contents |
| The project specific code for this effort is stored in this file. It is based upon an example Medium One provides to demonstrate how embedded devices can interact with the Internet of Things (IoT) platform backend. |
| When working on a project that is made publicly available, there is always a risk of exposing sensitive data such as passwords or API keys. Instead of hardcoding such information directly into the firmware and having to remember to alter the code prior to each “git commit,” we can instead create an unpublished header file to store this information. Note that we have provided an example of the header file in the GitHub repository. The example is named mysecretstuff.h. Be sure to rename the file to secretstuff.h before attempting to compile the code on your computer. |
| This is a custom header file written for interacting with the CO2 sensor. A header file is where the functions and variables are declared. The #include preprocessor directive is used to include this library in the main sketch.cpp file. |
| The source code used to interact with the CO2 sensor is found in this file. |
Libraries
The preprocessor directive #include lets us add libraries into our projects. This promotes code reuse; unless you have very specific needs, reinventing the wheel is not necessary. This project uses the following libraries:
<PubSubClient.h>: This library enables the use of the Medium One Message Queuing Telemetry Transport (MQTT) communications API. It handles a lot of the messy details for using the protocol by reducing our interaction to a series of function calls.<WiFiEsp.h>: Microchip Xplained boards have onboard Wi-Fi to make interacting with web services in the cloud straightforward. This library contains all the code needed to interact with the Wi-Fi chipset.<WiFiEspClient.h>: This will allow us to create a web client (Transmission Control Protocol [TCP]/Internet Protocol [IP] layer) that in turn can use the MQTT protocol to interact with the Medium One IoT web service (application layer).<Wire.h>: The h library provides foundational code necessary to interact with the I2C hardware. The BME280 temperature/humidity sensor and the soil moisture sensor occur over the I2C serial communications protocol. Component-specific libraries will build upon this library to provide functionality for their respective parts.<Adafruit_Sensor.h> and <Adafruit_BME280.h>: These libraries provide support functions essential to interact with the temperature/humidity sensor. These libraries are available for download here.<Adafruit_seesaw.h>: This library provides functions to interact with the STEMMA soil moisture sensor. This library for this can be found here."SoftwareSerial.h": The h library allows for a software-based serial communication channel on any two general-purpose input/output (GPIO) pins (RX and TX). While not as fast as the hardware serial port, it does allow for separate serial channels for debugging and interacting with a Wi-Fi chipset."secretstuff.h": This header file contains sensitive information such as Wi-Fi passwords and the Medium One passwords and API keys. Notice that this header file is encapsulated by quotation marks and not < and > that the other header files utilize. This is because the secretstuff.h header file resides in our project-specific firmware folder and not in the header files library that all projects can use. This file location makes this header file only accessible to the project’s firmware.
Variables and Constants
These are variables you might want to tweak to accommodate your specific design choices:
static int heartbeat_timer = 0: A timer to ensure communication connectivity between the microcontroller and the Medium One sandbox dashboard even if a sensor fails.static int sensor_timer = 0: A timer to track the length of time since the last packet of sensor telemetry was sent to the Medium One dashboard.static int heartbeat_period = 60000: The amount of time, in microseconds, between heartbeat signals sent to the Medium One dashboard.long lastReconnectAttempt = 0: The storage location of the timer value of when the last connection was made.static int sensor_period = 5000: The interval between taking readings from the sensors.const float vref = 5.0: The operating voltage of the microcontroller, which is an essential verification for analog-to-digital conversion calculations. This voltage may require an adjustment with use of a 3.3V operating voltage microcontroller.const float phOffset = 0.0: The offset added to the pH calculation formula. This value is determined during the calibration process of the pH sensor.const int phSensorPin = A0: The analog input (A0) pin to which the pH sensor connects.const int co2SensorPin = A1: The analog input (A1) pin to which the CO2 sensor connects.
A quick note on the const and the static keywords:
Placing the const keyword in front of the variable type ensures that value will not change during execution. In effect, creating a constant instead of a variable. The advantage of const versus #define is that since the variable is declared with a type, the compiler ensures that the variable type is respected throughout the code.
The static keyword ensures that the value stored in the variable remains the same (unless specifically changed by the code), even as a functions call goes out of scope. When the function is called again later, the value that was held previously in the static variable will still be there, versus declaring and initiating the variable as if it was the first time the function was called.
Objects
SoftwareSerial soft(2, 3): This creates a software-defined serial port with microcontroller 2 pin serving as the RX pin and microcontroller 3 pin serving as the TX pin. (NOTE: You will need to change the baud rate in Sketch.cpp for soft.begin to 115200 in order to communicate with the ESP WiFi Module)WiFiEspClient wifiClient: This provides an object that allows our code to interact with the onboard Wi-Fi chipset.PubSubClient client(server, port, callback, wifiClient): This establishes the MQTT connection to Medium One and thus allows our code to interact with the web service via simple function calls.Adafruit_BME280 bme: This creates an object to interact with the temperature and humidity sensor.Adafruit_seesaw soilSensor: This creates an object to interact with the STEMMA soil moisture sensor.co2_sensor co2sensor: This creates an object to interact with the CO2.
Functions
void setup(): This first function to run will initialize many of the hardware and software components required such as the serial communications, Wi-Fi connection, sensor interface, and interactions with the GPIOvoid loop(): This is the core of the functionality that will run continuously. Care is taken to ensure the main loop has minimal code and that functionality is handed off to specialized functions that are each responsible for individual tasks needed to make this project work.boolean connectMQTT(): This function connects the Microchip Xplained board to the Medium One MQTT server.void sensor_loop(): This function handles polling the BME280 environmental sensor for temperature and pressure data and transmits it to the Medium One sandbox dashboard.float getPHlevel(): This function requests the pH level from the pH sensor. A floating-point number (from 0.0 to 14.0) is returned.void heartbeat_loop(): This loop provides a heartbeat to the Medium One server. A heartbeat is a consistently repeating packet that lets the server know that our device is still alive and able to communicate even if there is no data to pass. This is very useful for applications that only transmit data once an event occurs in the real world.
Setting Up Medium One
Medium One (Figure 4) provides IoT developers a platform for which their IoT devices can communicate and compile data sets from across multiple IoT devices. They provide an excellent tutorial on getting started with their service: Click here to learn more about Medium One.
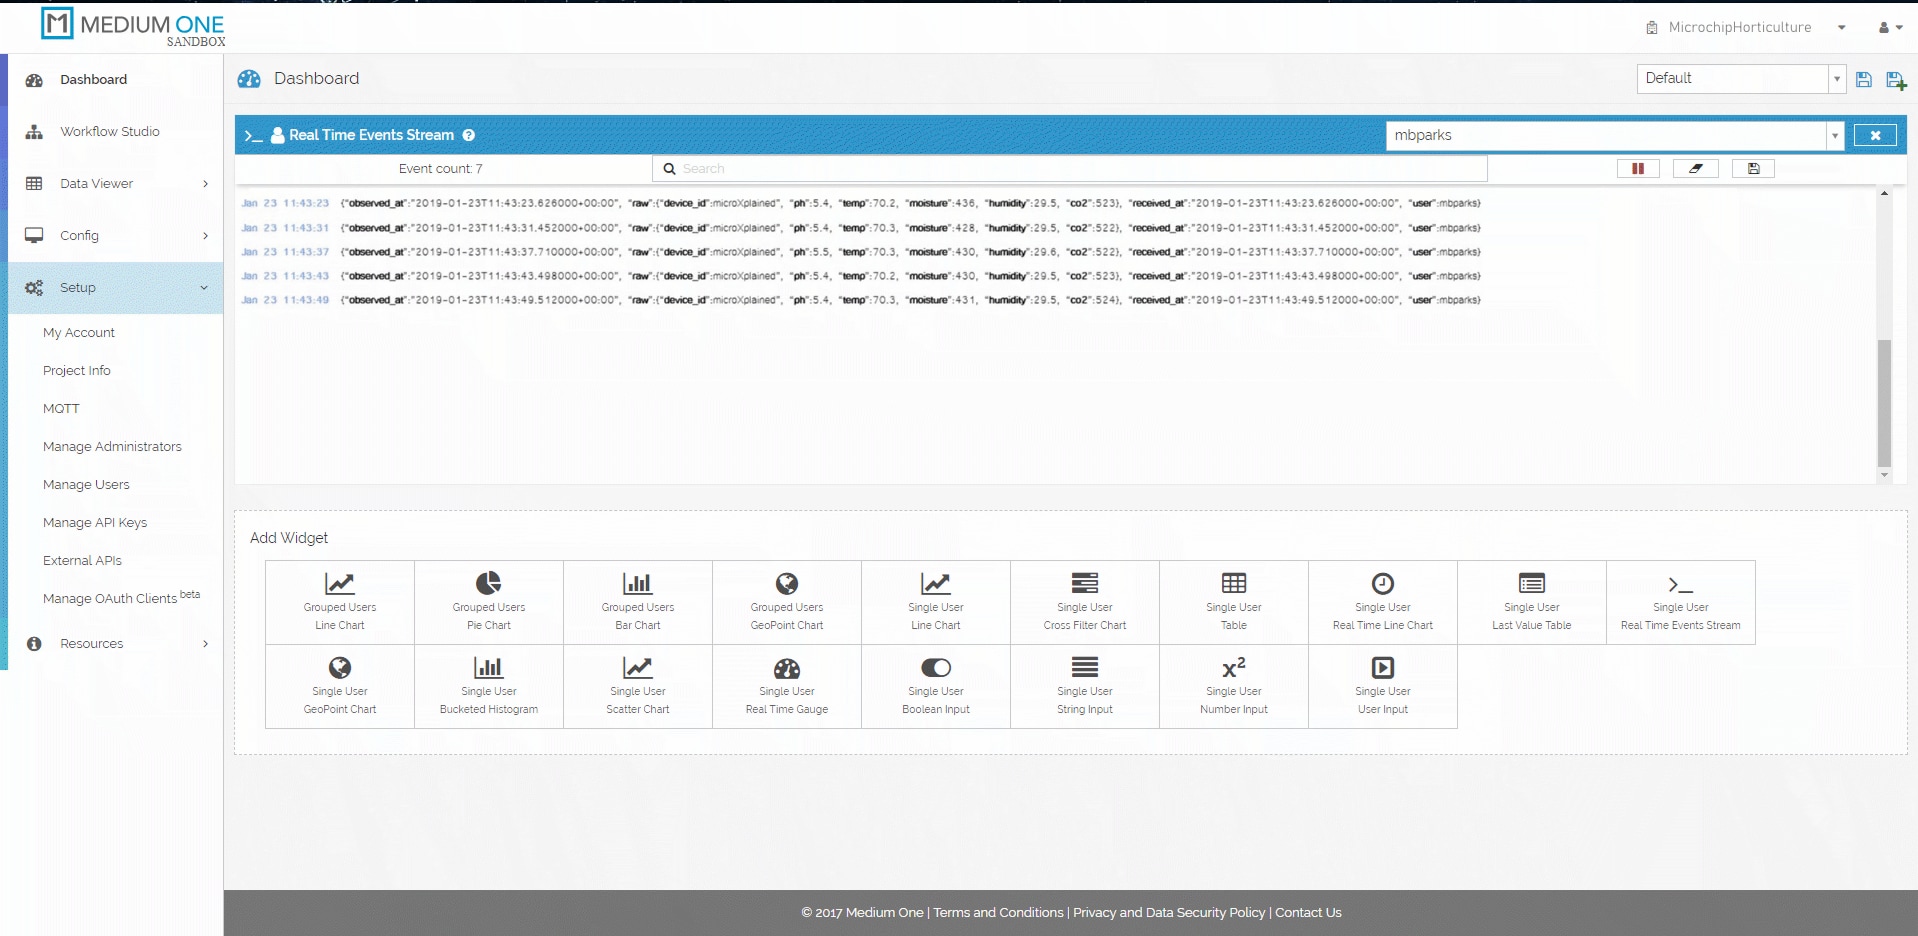
Figure 4: In the Medium One sandbox, notice the data coming into the dashboard in the center. Passwords and API keys are accessible from the left-hand navigation bar. (Source: Mouser)
The guide will focus on preventing the gotchas that we experienced in setting up the Microchip Xplained board to communicate with Medium One via their MQTT API. Our project will leverage Medium One’s MQTT protocol. MQTT is a publish-subscribe (pub/sub)-based messaging protocol. It sits atop the TCP/IP protocol. MQTT, as opposed to Representational State Transfer (RESTful) APIs, requires a centralized message broker. Thus, endpoint devices cannot directly communicate with each other. This has pros and cons. RESTful APIs rely on the client to always initiate communications, whereas MQTT allows a server to push data, thanks to the pub/sub architecture. RESTful devices can communicate with each other directly. MQTT relies on a centralized message broker (e.g., a server in the cloud).
To set up the Medium One sandbox:
Create an account at https://www.medium.one by purchasing an inexpensive one-year license using part number
349-M1IOTPROTO.- Create a new project at the top-right corner of their web-based user interface. Then, after the new project is activated:
- Note some crucial pieces of information that Medium One automatically generates for use in the firmware. Wpecifically, we will store this information in the secretstuff.h header file. The key pieces of information include:
- Project ID: This alphanumeric string is a unique identifier assigned to this specific project. It lets Medium One know what project to direct the Microchip Xplained board environmental data to if we have multiple projects hosted with their web service.
- API Key: This is an auto-generated alphanumeric string created to allow us to log in and use Medium One’s API services.
- MQTT ID: The MQTT ID is an alphanumeric string generated by Medium One. It’s important to note that the Login ID is not the same as the MQTT ID. The Login ID is an end user created, human-readable string (for example, “janedoe”). The piece of information we need for the firmware is the MQTT ID and NOT the Login ID. This is important, considering each project can have multiple contributors.
- User Password: This is created by each user when their account is established for the project. For security reasons, it is not displayed anywhere, so be sure to remember this password!
- Determine where these pieces of information are accessible from Medium One’s website:
- Setup→Project Info: This will display the Project ID.
- Setup→Manage Users: This is where the Login ID and the user’s MQTT ID can be found. Recall that it is the MQTT ID that is required for the firmware and not the Login ID.
- Setup→Manage API Keys: This is where to find the API Key.
- Note two other key pieces of information that the firmware will require:
- The Medium One MQTT server URL: mediumone.com
- The TCP port, which will be either 61619 (unsecured) or 61620 (secured)
- Set up a dashboard to view the data received from the Microchip Xplained board. From the Dashboard screen:
- Select the Single User Real Time Events Stream widget option at the bottom-right corner of the screen.
- Select the user you want to view using the dropdown menu.
This step should create a dashboard that listens for data. If a green play button is visible, then click it to begin listening. Otherwise, there will be a red pause button to pause the feed if necessary. If the dashboard works, then raw MQTT packets from the Microchip Xplained board should begin displaying in the browser. - Ensure that the Microchip Xplained board is receiving power via a USB connection to a computer or via an alternating current (AC) outlet wall wart power supply.
Getting Started with Your Project
Before getting started, take time to do some testing and calibrating, and then start monitoring your horticulture project!
Check for Errors
Hook up the Xplained board to a computer and fire up a serial terminal. You should see telemetry from the various sensors flowing down the screen every few seconds. If not, check to see if there are any error messages. Some common errors include:
- Reversing power and ground wires to sensors.
- Reversing the data (SDA) and clock (SCL) wires to the sensors.
- Not wiring the TX/RX pins correctly between the Xplained microcontroller board and the SparkFun WiFi Module (via the bidirectional logic converter board). The TX pin from one board should connect to the RX pin on the other board.
- Not supplying 3V to the Low Voltage (LV) side of the bidirectional logic converter board. Not supplying 5V to the High Voltage (HV) side of the bidirectional logic converter board.
- If powering the device, not ensuring the power supply can deliver at least 1A of current.
Calibrate the Sensors
Another very important point is the need to calibrate the sensors. Despite the best intentions of manufacturers, no two sensors that come off the assembly line are quite the same: Thus the need for the calibration process. One common method employs a potentiometer that can adjust the output signal to a prescribed voltage or current when a specific input signal is injected. Typically, the potentiometer influences the negative feedback loop of an operational amplifier, which is typical for a sensor device.
Calibration is not a one-time, upfront activity. Many sensors are affected by a phenomenon known as sensor drift. Over time, the operating environment or operating conditions can begin to affect the circuit and the output signal so much so that the same inputs will generate a different output over time. Left unchecked, the drift will become increasingly worse. Therefore, it’s crucial to remember that some devices, such as those used in industrial, agricultural, and horticultural applications, may have an expected service life that’s measured in decades. Ensuring that calibration occurs in line with the manufacturer’s prescribed manner and timeline is vital for safe and reliable system operations.
Create Charts
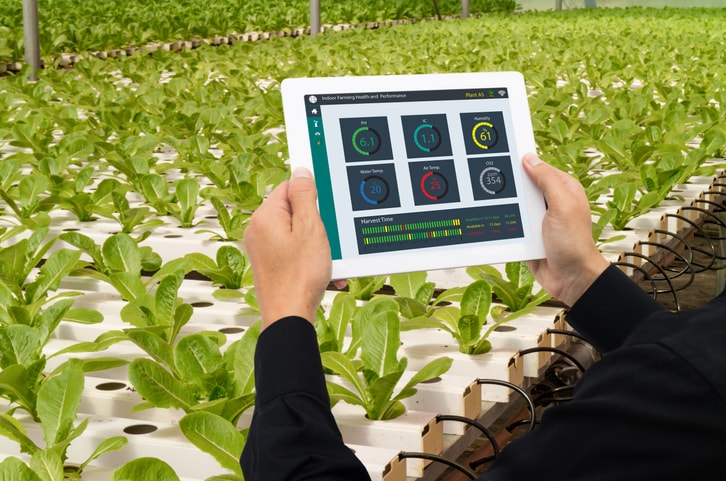
Once the data is flowing into the Medium One dashboard, it’s possible to use the data to create charts and other visualizations for quick, at-a-glance data analyses to ensure all parameters are within expected tolerances (Figure 5).


Figure 5: Raw data is great but visualizing the data in charts makes data easy to analyze and spot problems. (Source: Mouser)
Keep Designing
Here’s one last design idea: Since many of the factors here have a great effect on plant health and might require human intervention, it may be advisable to encode error condition flags and transmit those flags with the raw telemetry data. This design addition will require a two-byte packet to encode all possible error conditions, which will account for each sensor and whether high or low conditions exist, as shown below:
Byte 1
Temperature Sensor | Humidity Sensor | CO2 Sensor | pH Sensor | ||||
Temp Low | Temp High | Humidity Low | Humidity High | CO2 Low | CO2 High | pH Low | pH High |
0 | 1 | 2 | 3 | 4 | 5 | 6 | 7 |
LSb (least significant bit)
Byte 2
Moisture Sensor | Reserved Bits for Future Use | ||||||
Moisture Low | Moisture High | ||||||
8 | 9 | 10 | 11 | 12 | 13 | 14 | 15 |
MSb (most significant bit)
Placing a “1” in any of these flags will indicate an “error state” detection. For example, 0×0810 will indicate a high pH alert and a low moisture alert.
Conclusion
Whether you’re a seasoned gardener or just starting out, this project can provide you the means to create an ideal and efficient environment to cultivate plants for consumption or transplant. The sensors and IoT capabilities can help you monitor and makes changes as needed to help anyone have a green thumb.
Don’t forget to let us know if you tried this project out for yourself. How well did the project work for you? Would you expand upon it? If so, let us know on Facebook, Twitter, or LinkedIn.